home > interesting topics > statistics > Australian statistics
Australian Jehovah's Witness Publisher Statistics
This page contains the most detailed statistical analysis regarding Jehovah's Witnesses in Australia, extrapolated from Watchtower's Service Year Reports and Australian Census data. This data reveals a significant fall in growth since 1995.
The growth in Jehovah's Witnesses in Australia has been relatively stagnate since 2000. As percentage of the population, they have seen a dramatic decline, dropping from 1 Jehovah's Witness for every 293 Australians in 1998, to just 1 in 379 in 2023. The number of congregations has also been decreasing.
Note that hours preaching by country stopped being published in 2016. "Average publisher" figures were not published by country in 2017 or 2018, but were again since 2019, which is why there are gaps in some graphs.
The number of congregations provides insight into Jehovah's witnesses. The number of congregations has been in decline since 2016. Part of this is consolidation, which will continue to occur in ever higher rates if people stay home and dial in to meetings. Since Watchtower took the ownership of kingdom halls off the congregations, they have started selling kingdom halls and collecting the proceeds to cover the gap between donations and costs.
Jehovah's Witness numbers have stagnated during a period of extended population growth in Australia. In 1998, there was 1 Jehovah's Witness for every 293 Australians, their year of highest density. In 2023, there was 1 Jehovahs Witness for every 379 Australians. It is hard to convey how dramatic this drop is; in 25 years, the percentage of Jehovah's Witnesses as a proportion of the Australian population has declined by 29%.
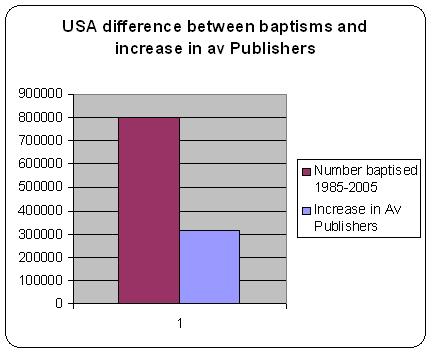
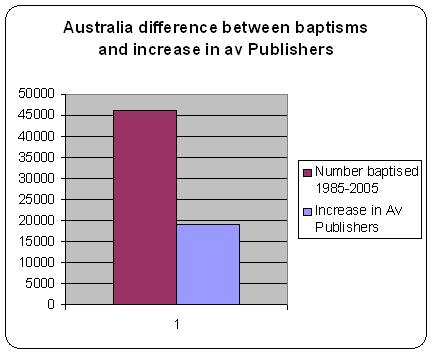
The following graph is an estimate of the number of Australian Witnesses that leave (stop publishing) each year. This has been calculated as the difference between baptisms and the increase in publishers. The figure is an indication only, since it does not take into account publishers that do not get baptised, or Witnesses that die. The importance of this graph is the strong trend line. The number that stop publishing each year has grown to be similiar to the number baptised. The total number of new converts baptised as a result of the preaching work, plus baptisms of Jehovah's Witness children, barely covers the number that leave/die each year.
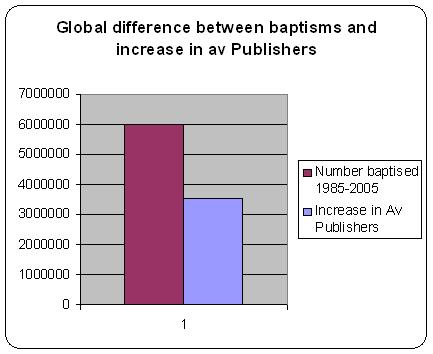
The following series of graphs are most revealing, showing that in the USA and Australia during the 20 years between 1985 and 2004, the increase in publishers is less than half the number baptised, even after taking into account a 0.87% yearly death rate. The global result is less dramatic as people in undeveloped countries are less likely to have the information required to help them leave.
Average publisher figures have been used in preference to peak publishers for the sake of accuracy. Peak publishers includes double counting. For example, when a publisher submits two or more reports in the same month all are added to the current month.
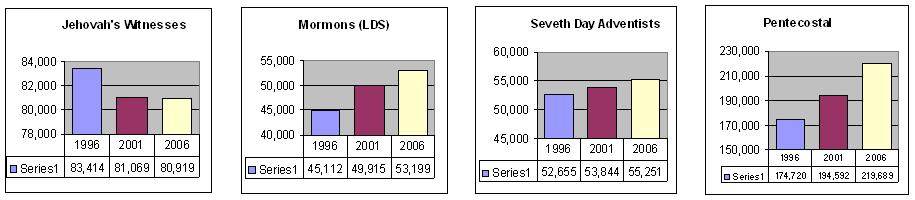
The following figures are from the Australian Census 2006 as found at abs.gov.au (30th June 2007). These statistics are revealing in comparison to other Christian religions, bringing into question the claim that only Witnesses preach. Whereas most Christian religions are growing, particularly those actively preaching such as Mormons, Seventh Day Adventists and Baptists, the number of people admitting to being Jehovah's Witnesses is falling. Jehovah's Witnesses have fallen over the last 10 years by 3%, whilst Baptists have grown by 7% and Mormons by 18%.

There are interesting insights when comparing figures from the 1996 census with the 2016 one. This 20 year period spans back to the introduction of the internet.
The first thing to note is that there has been no growth in people claiming to be Jehovah's Witnesses on the census, yet a 33% growth in the Australian population, a significant real decrease in Jehovah's Witnesses.

The second graph shows that the number reported on the census has not grown, whereas Watchtower publisher records claim they have. One reason is the ability to report less time - 15 minutes per month. The other is that inactive ones are less likely to still believe it is the truth, due to the growth of information on the internet over that time, and so not as many inactive ones still claim to be Jehovah's Witnesses on the census.

You may wonder why the census shows over 80,000 whereas Watchtower claims less than 70,000 Jehovah's Witnesses. This is because Watchtower only counts "publishers", whereas the census also includes children. On the 2011 census the number of children aged 0-9 claiming to be Jehovah's Witnesses was 9,395, which accounts for most of the difference. The rest can be mostly attributed to inactive ones.
The fall in growth since 1995 coincides with the year the Internet went mainstream, which provided ready access to details about Watchtower history, doctrine and current practice. 1995 also saw a significant change in understanding of the "generation" doctrine. Despite millions of hours of preaching, growth of Jehovah's Witnesses is less than the population growth, showing that new converts are being outpaced by the number of children born into the religion that leave each year.
The following table has been used to generate the above graphs.
The data is taken from the Watchtower global publisher reports that are printed each year. For the full reports see Historical Watchtower Data. For analyses of other Watchtower publisher statistics see:
Written 2010, latest update January 2024.
![]() Paul Grundy 2005 - 2024
Paul Grundy 2005 - 2024